
TrilateStation
2020 / An interactive map framework for science center and museum exhibitions.

TrilateStation is an explorative concept for interactive science center design that strives to connect virtual and physical learning environment through a spatial framework. In its current state, it exists as concept sketches and a demo application.
The project was developed for the science center Universeum and displayed at the 2020 IDXPO at Visual Arena, Lindholmen.
Role: Project management, Concept, User Research, Animation, Evaluation, Video Prototyping.
Context: Chalmers University of Technology; Master Programme in Interaction Design & Technology; Course: Major Project in Interaction Design, 7.5hp; Group project with Aditya Giridhar, Andreas Mathisen, Gustav Svensson, Tanvi Vidhate and Premthip Yaowapatsiri. Client: Universeum
Design Challenge
The initial challenge was to design an installation for the science center Universeum. The project should incorporate Universeum’s new digital portal, Digitala Universeum to some extent, and should utilize the Quantified Self philosophy to appeal to the selected target group: 12-16 year old teenagers.
Research and Ideation
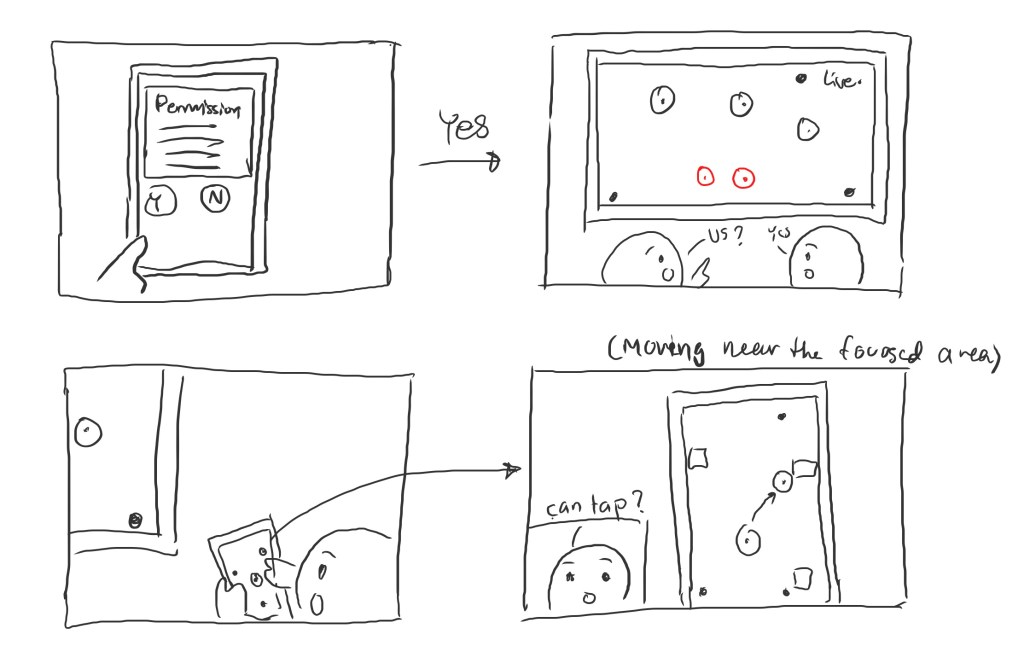
Our original idea was centered around coming up with a way to explain how tracking technology such as GPS worked. We wanted to somehow utilize tracking technology inside Universeum to enrich the overall visitor experience while at the same time teaching visitors about the technology they were using.
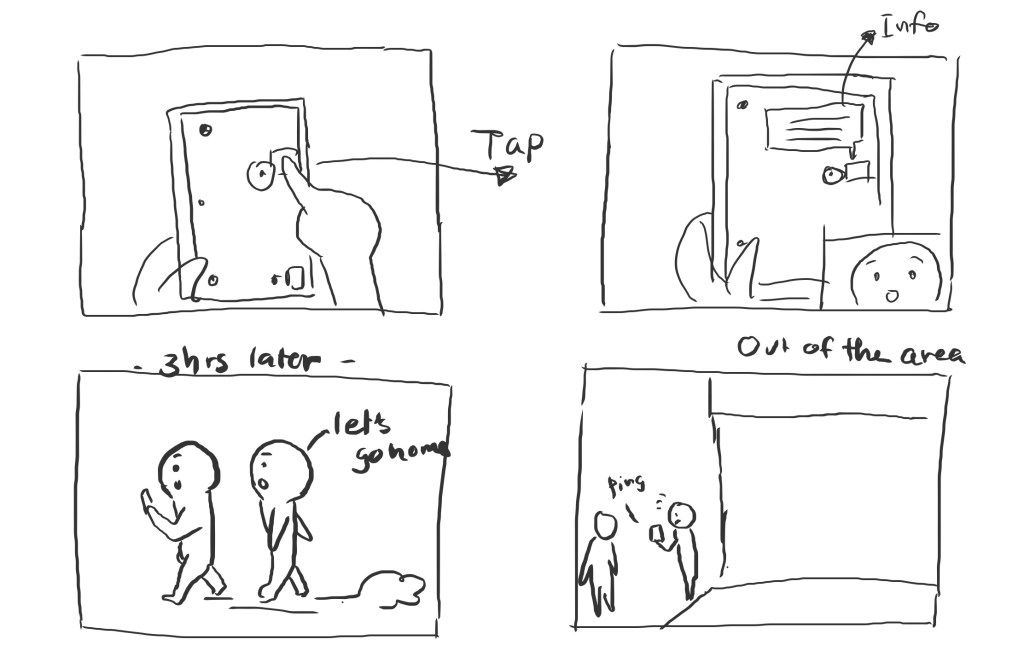
The golden path was translated into a storyboard, that was used for user testing with Universeum guide personnel.


Explaining the Science
The technology being used for the indoor tracking on the map is called Trilateration. It utilises Bluetooth Low Energy (BLE) Beacons to find the phone’s current position. To explain the trilateration technology and make visitors aware of the technology they come in contact with, we created an animation.
Interface Design
The video explanation and an interface prototype were used to evaluate the concept with children from the target group. The idea was well received. Most iterative work focused on making the final map design as self-explanatory as possible.


The Quantified Self
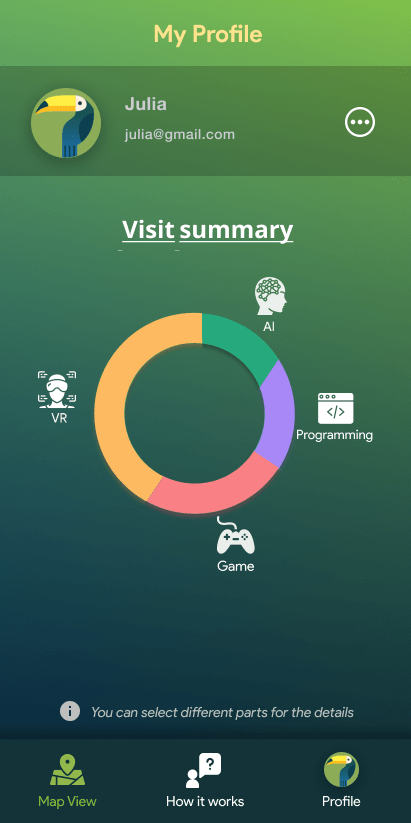
By registering how much time the visitors spend on different activities, he visitors can then learn more about what they appear to find most interesting, and see what they might have missed. By bringing a quantified version of the science center home when the visit is over, they can keep exploring the topics from the science center whenever they like.

The Final Design
The iteration resulted in a demo-version of the application that could be used during the 2020 IDXPO to get information about the other projects in the exhibition. An animated storyboard was created to explain the purpose of the application in full.
